This article will help you understand how the MarketBeat MarketRank™ tool analyzes every category. You'll also understand how to use the MarketRank™ tool and other analysis tools as you perform your due diligence for stocks in your portfolio and those on your watchlist(s).
What is MarketRank™?
MarketRank™ is a proprietary tool that MarketBeat uses to assign a score to every stock in its database, which includes over 1.5 million stocks. The overall MarketRank™ score is the average of a company's scores in the various categories.
A company's MarketRank™ score is one of the variables that investors can choose in one of the many stock screeners available on MarketBeat. Every stock is given a rank from one star (the lowest) to five stars (the highest). Each star correlates to a numerical score with 5.0 indicating a five-star stock.
How MarketBeat Scores Stocks
The MarketRank™ score is the aggregate of a company's scores in the various categories. Every stock is given a rank from one star (the lowest) to five stars (the highest). Each star correlates to a numerical score with 5.0 indicating a five-star stock.
You can find a list of the top MarketRank™ stocks on the MarketBeat website. Here's a description of every column you'll see on that list of stocks.
Rank
The top MarketBeat stocks list from 1 to 100. If you sort by another factor, the rank lets you know where the stock falls on that list. For example, as of December 23, 2022, Ares Management Corporation (NYSE: ARES) has the highest overall score among MarketRank™ stocks.
Company
"Company" refers to the company name and stock ticker. You can click on the ticker name to go directly to the profile page for that stock.
Share Price
"Share price" shows a stock's current stock price and, below it, the gain (green) or loss (red) by percentage in the current trading session. When the market closes, this will show the percentage gain or loss at the close of the last session.
Overall Score
The overall score is the MarketRank™ score when you take the average of all the individual categories. The highest score a stock can receive is 5.0. On December 23, 2022, the highest ranking MarketRank™ stock had a score of 3.9.
Analysis Score
In this category, MarketBeat evaluates a stock based on how analysts view the stock. The MarketRank™ analysis score averages the following data points:
- Consensus rating: This is the average rating (buy, moderate buy, hold, sell) based on all the analysts covering the stock. It takes into account the number of analysts that are covering a stock. Generally, the more analysts covering a stock, the more weight the consensus rating carries.
- Price target upside/downside: This tells you the upside or downside for a particular stock based on the current consensus price target. The price target can change even if an analyst does not alter their overall rating on a stock.
- Amount of analyst coverage: Periodically, analysts update their guidance on a stock, typically around earnings season. The MarketRank™ tool bases this score on the coverage a stock receives in the previous 90 days.
Short Interest Score
MarketBeat evaluates a stock based on the impact of short interest in this category. The MarketRank™ analysis score is based on the average of the following data points:
- Percentage of shares shorted: Percentage of the total number of outstanding shares shorted. In general, a higher number is bearish. However, that can depend on the popularity of the stock. For example, Apple Inc. (NASDAQ: AAPL) is one of the most widely owned stocks. Even though it "only" has 0.79% of its shares shorted, it is still one of the most shorted stocks in the market.
- Short interest ratio/days to cover: This tells you the company's short interest compared to trading volume. The higher the ratio (i.e., the more days it takes to cover) could indicate stocks that are candidates for a short squeeze.
- Change versus previous month: This tells you how much the short interest has increased or decreased for a stock in the last 30 days. It can help you determine investor sentiment. When the number rises sharply, it can indicate pessimism.
Dividend Score
In this category, MarketBeat evaluates a stock based on the impact of its dividend, which is a share of the company's profits paid to investors as cash. The MarketRank™ analysis score is based on the average of the following data points:
- Dividend yield: Dividend yield tells you the current dividend yield and where that yield places the stock among other dividend-paying stocks. Because stock price impacts dividend yield, this is a dynamic number.
- Dividend growth: Dividend growth tells how many years (if any) a company has increased its dividend. Generally, companies raising dividends are better candidates for dividend investors. However, that may also make them less than ideal for growth investors.
- Dividend coverage: Dividend coverage tells you the current dividend payout ratio and the sustainability of the payout. Dividend payout ratio is influenced by a variety of factors. Generally, you can accept a higher dividend payout ratio from companies with a history of continually growing earnings.
- Dividend sustainability: Dividend sustainability tells you the forecasted dividend payout ratio over the next 12 months and how likely the company will be able to increase its dividend continually.
ESG Score
ESG stands for "environmental," "social" and "governance." The relatively new metric helps evaluate stocks. The MarketRank™ analysis score is based on the average of the following data points:
- Overall ESG score: MarketBeat partnered with Upright to generate a company's impact score based on ESG metrics. The overall ESG score gives you that net impact score and a brief synopsis of why the company scored that way. You also have a direct link that can help you understand more about why a company received the score it did.
- Environmental sustainability: This shows a company's environmental impact score.
The phrase "buy the rumor, sell the news" has meaning behind it. When a company gets favorable or unfavorable news or social media coverage, it can impact the stock price. The MarketRank™ analysis score is based on the average of the following data points:
- News sentiment: News sentiment gives you a company's news sentiment score, the average sentiment about a company based on its news coverage over the last seven days. Each item receives a score that ranges from 2 (the best) to -2 (the worst). You'll also see how that score ranks among other companies within its sector.
- News coverage this week: News coverage clues you into the number of articles for the company appearing in the current week and how that compares to the average number of articles per week.
- Social mentions this week: You can learn the number of Reddit mentions the company has received in the current week and how that compares to an average week.
- Search interest: Search interest tells you how many investors have searched for the company in the last 30 days. It also tells you how much of an increase or decrease (by percentage) occurs over the past 30 days.
- MarketBeat follows: "MarketBeat follows" tells you how many investors have added the company to its watchlist in the past 30 days. It also shows the increase or decrease (by percentage) in the past 30 days.
Ownership Score
Knowing who owns a stock is as important as how much of a stock is purchased. When a stock has a lot of interest from institutional investors, it usually indicates a level of trust in the company. Also, when company insiders are buying their company's stock, that can be a bullish signal. The MarketRank™ analysis score is based on the average of the following data points:
- Insider buying vs. insider selling: This metric tells you the dollar amount of stock that insiders buy and the amount of stock sold. Investors sell their stock for many reasons but only buy when they believe it is undervalued.
- Percentage held by investors: You can learn the percentage of a stock held by insiders. If this percentage is too high, it may indicate that the stock has less liquidity (more difficult to buy and sell).
- Percentage held by institutions: This tells you how much of a company's stock is owned by institutional investors. When institutions hold a company, investors can assume a company has a high degree of trust in the company.
Earnings and Valuation Score
One of the most critical elements of fundamental analysis is understanding how a company's earnings relate to its valuation. The MarketRank™ analysis score is based on the average of the following data points:
- Earnings growth: This tells you the amount analysts expect to increase or decrease over the next year. The numbers are given in percentage terms and dollars and cents.
- Price-to-earnings ratio vs. the market: This metric tells you what the company's P/E ratio is and how that compares to the average P/E ratio of all the stocks in the MarketBeat database.
- Price-to-earnings ratio vs. sector: This tells you how the company's P/E ratio compares to other companies within its sector.
- Price-to-earnings growth ratio: The price-to-earnings growth (PEG) ratio includes estimated earnings growth into the P/E ratio. A ratio above 1 indicates that a company may be overvalued.
- Price-to-book value per share ratio: This number helps investors understand a company's value regarding its assets and liabilities.
Indicators
Indicators tell you which factors contribute to a company's overall MarketRank™ score, moving higher or lower. It could include a new analyst report, a new analyst revision or an upcoming or just-released news item such as an earnings report.
View Details
"View details" gives you a shortcut to get to the company's profile page on MarketBeat.
How to Use MarketRank to Guide Your Research
MarketRank™ gives you a great tool to help you determine whether to buy a stock. However, in the end, it's only one data point. Here are different steps to use a stock's MarketRank™ score.
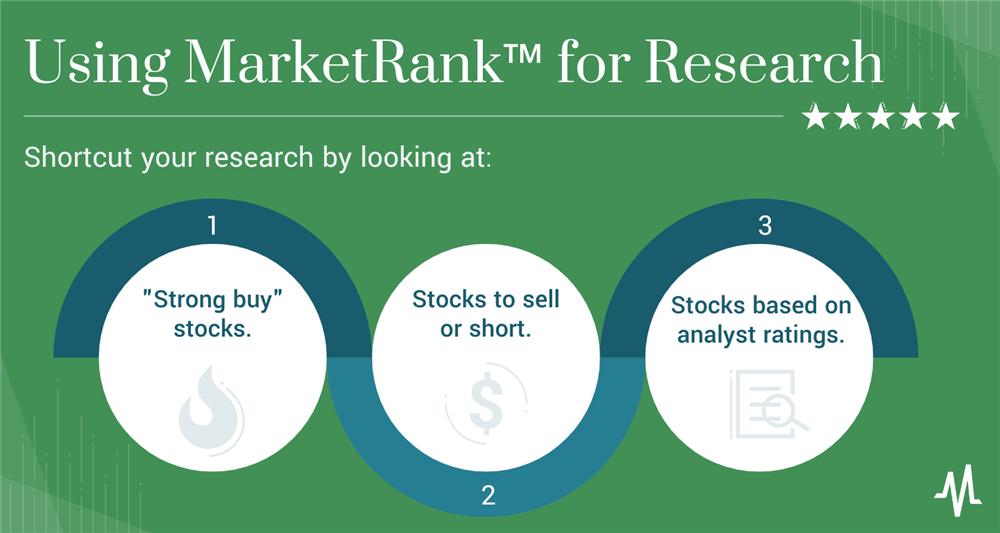
Step 1: Find "strong buy" stocks.
Most investors want to find the best strong buy stocks on the market. MarketBeat has a tool that lets you find top MarketRank stocks. However, this will give you a list of 100 stocks that includes all sectors, market caps and MarketBeat MarketRanks. You can sort the stocks by any or all of these categories. For example, you may want to screen for stocks with a MarketRank™ of three stars or higher. You can also use a company's MarketRank™ score to compare the best growth stocks.
Step 2: Find stocks to sell or short.
You can use the MarketBeat stock screener to sort by stocks with a MarketRank™ score of one or two stars. Within this list of stocks, you may find stocks with high short interest, which may be a good indicator that many investors are shorting the stock.
Step 3: Find stocks based on analyst ratings.
As noted, one element of the MarketRank™ score is its "analysis" score, which lets you identify stocks based on stock price targets and analyst ratings. It allows you to find the most upgraded stocks.
Shortcut Your Stock Research
Knowing you should invest in blue chip stocks is different than knowing which stocks are good. That's where MarketRank™ can help.
This proprietary tool allows you to see how a stock compares to other stocks in its sector and the broader market. A company's overall MarketRank™ score is based on various factors, so you can pick out the ones that matter most to you.
For example, the MarketRank™ can take a question like "should you invest in blue chip stocks?" and refine it by factors like a company's dividend history. It can help you understand why factors like a dividend payout ratio are just as significant, perhaps more so than its dividend yield.